Coming Soon to Android
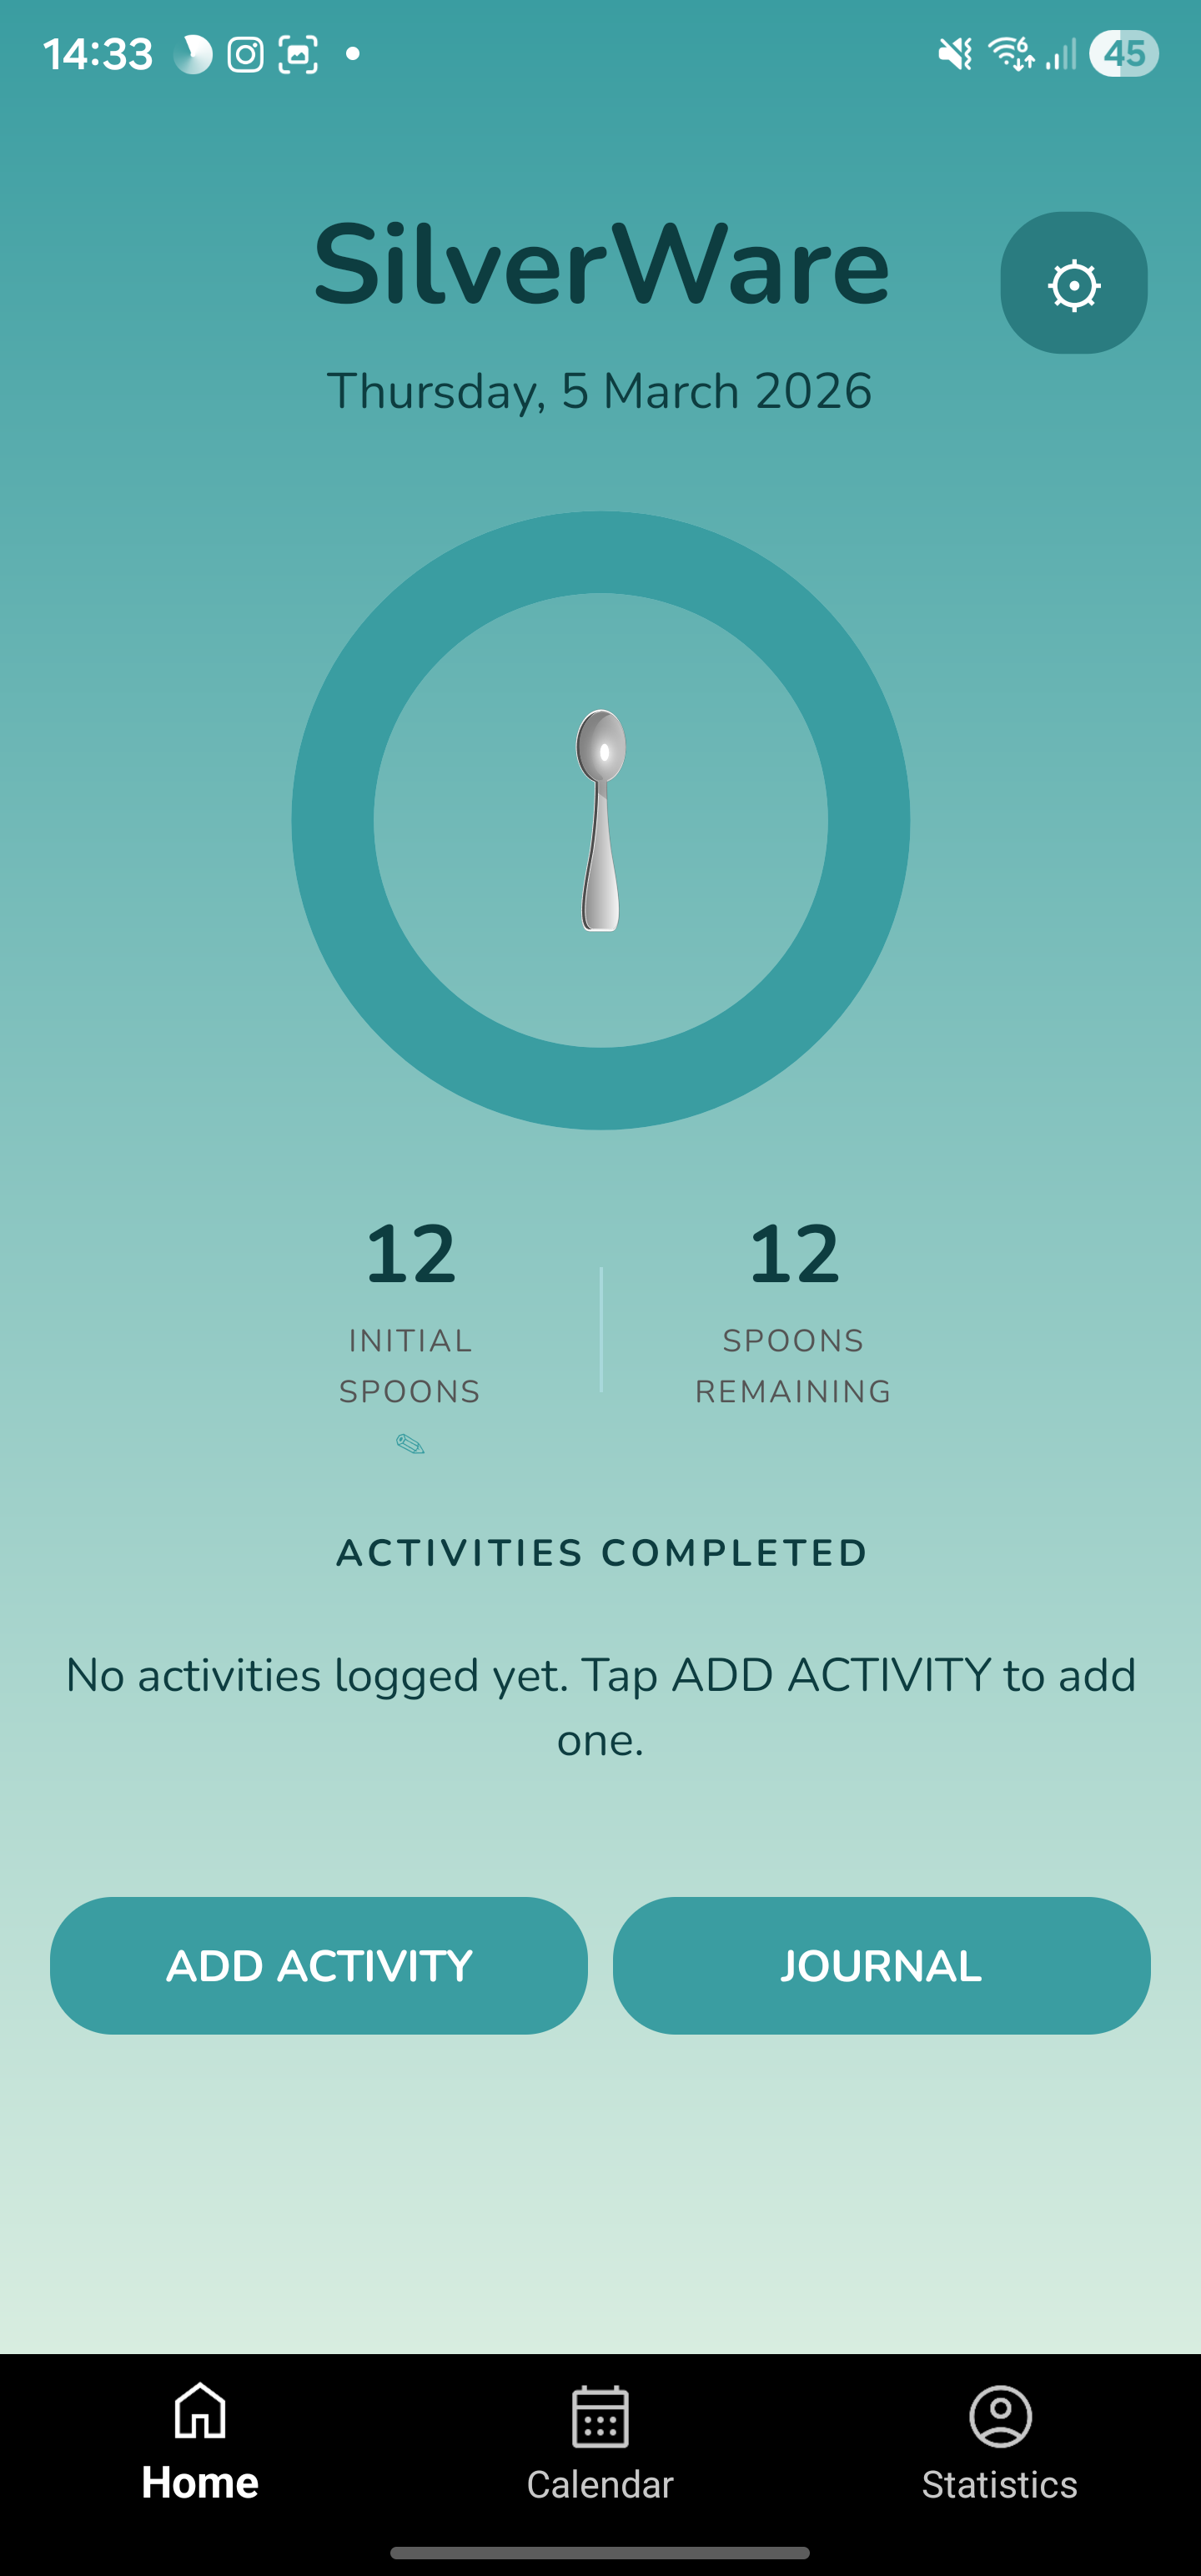
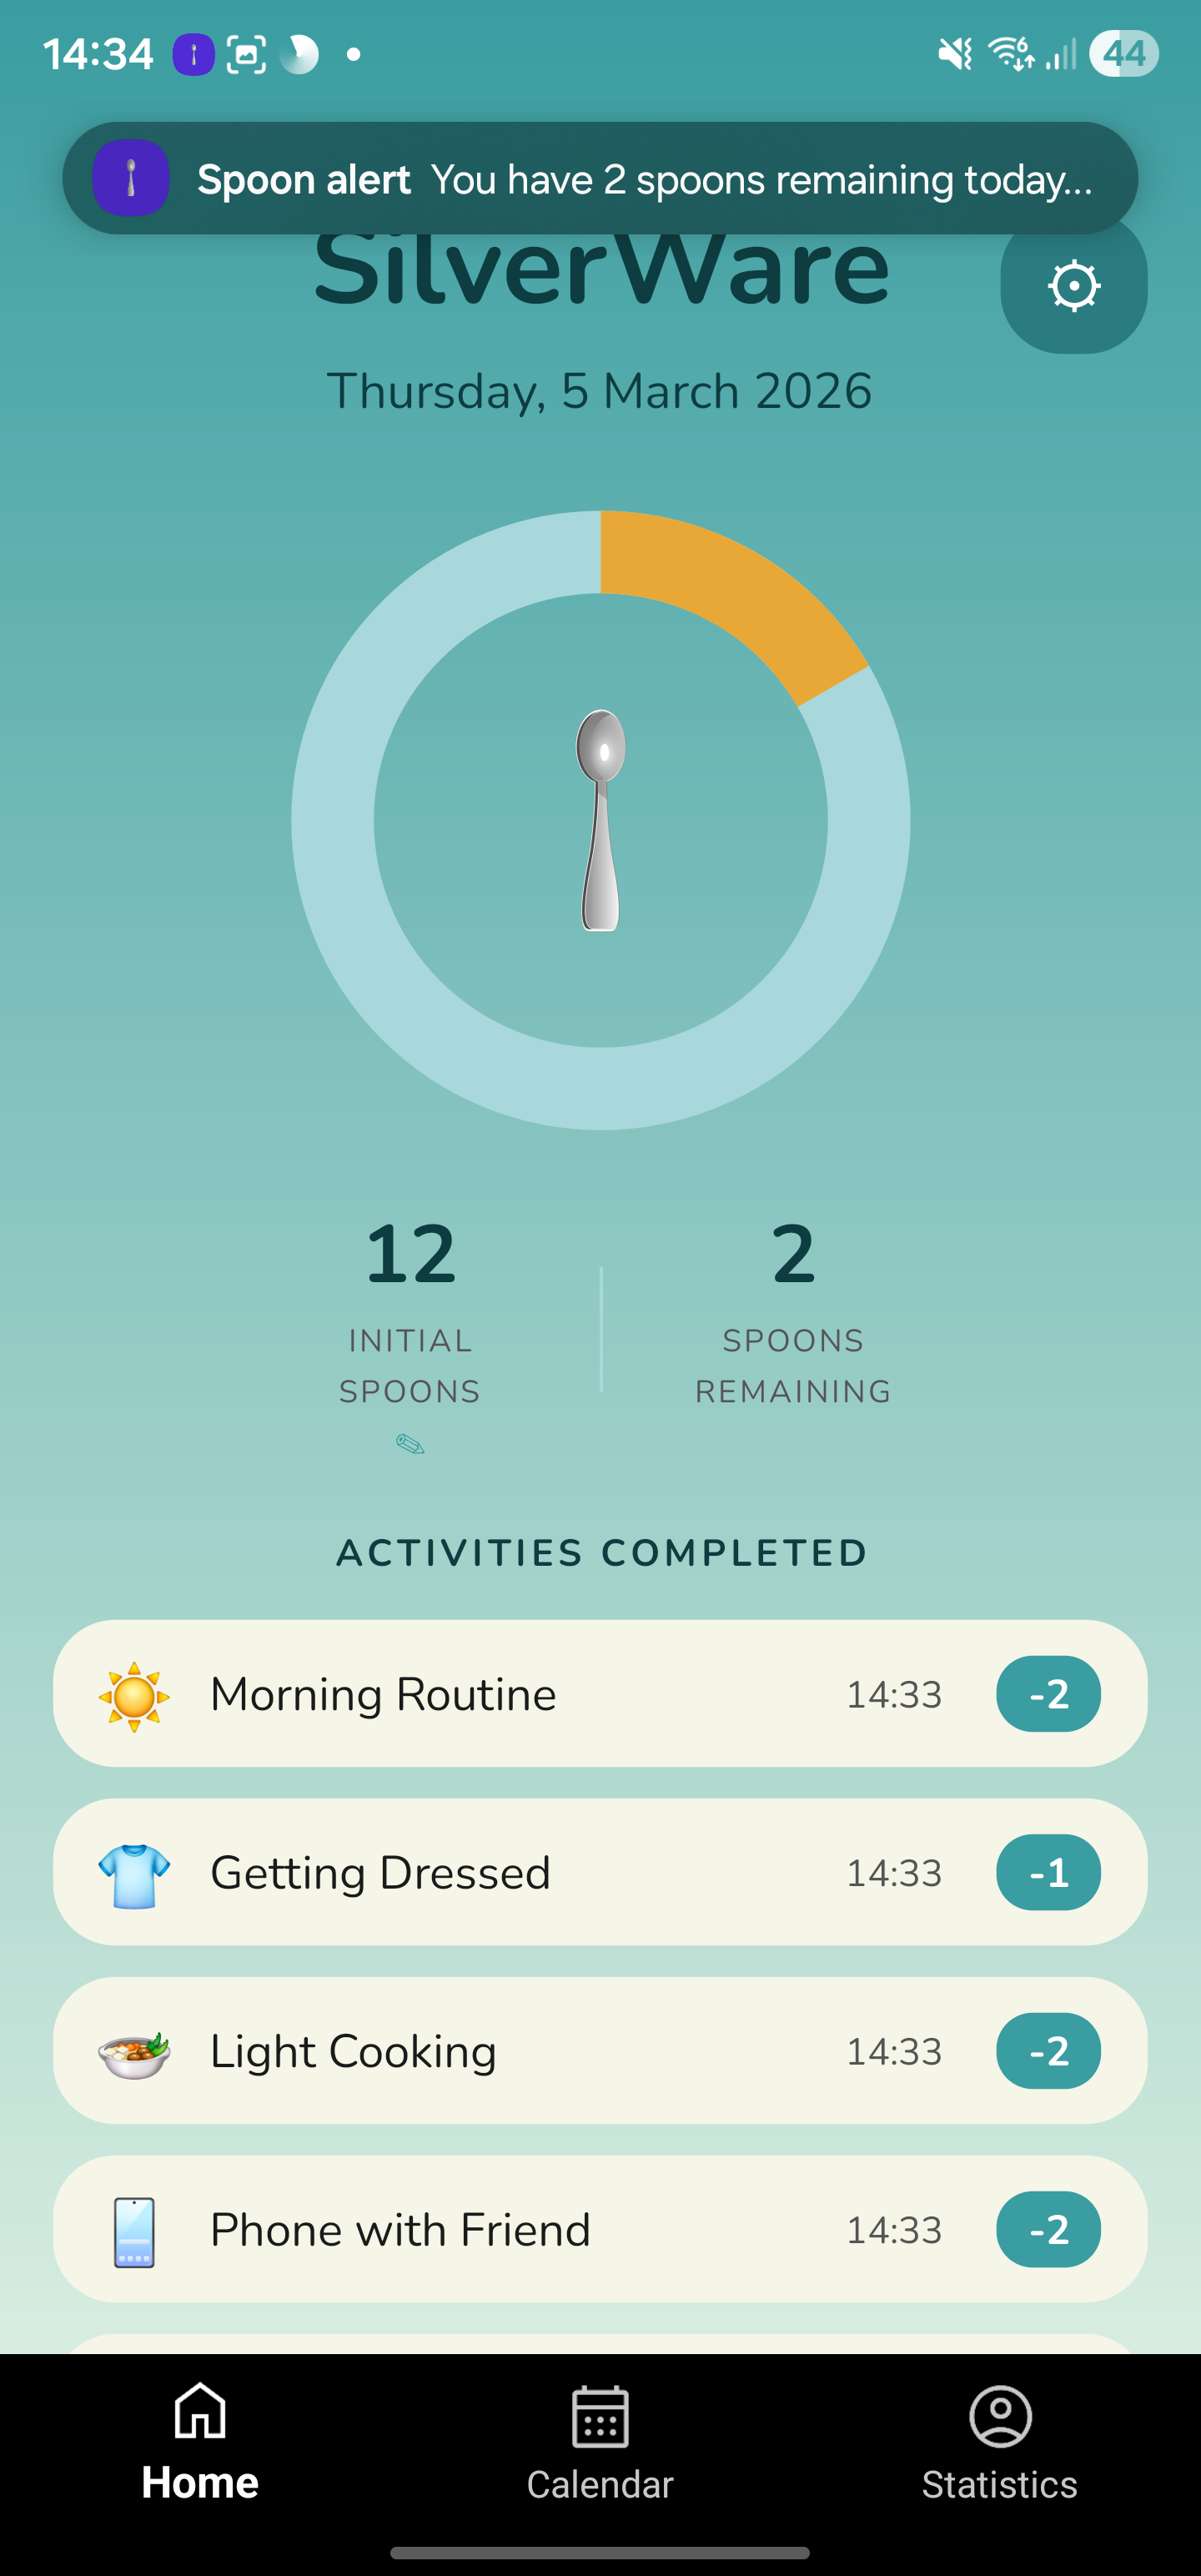
Every spoon
counts.
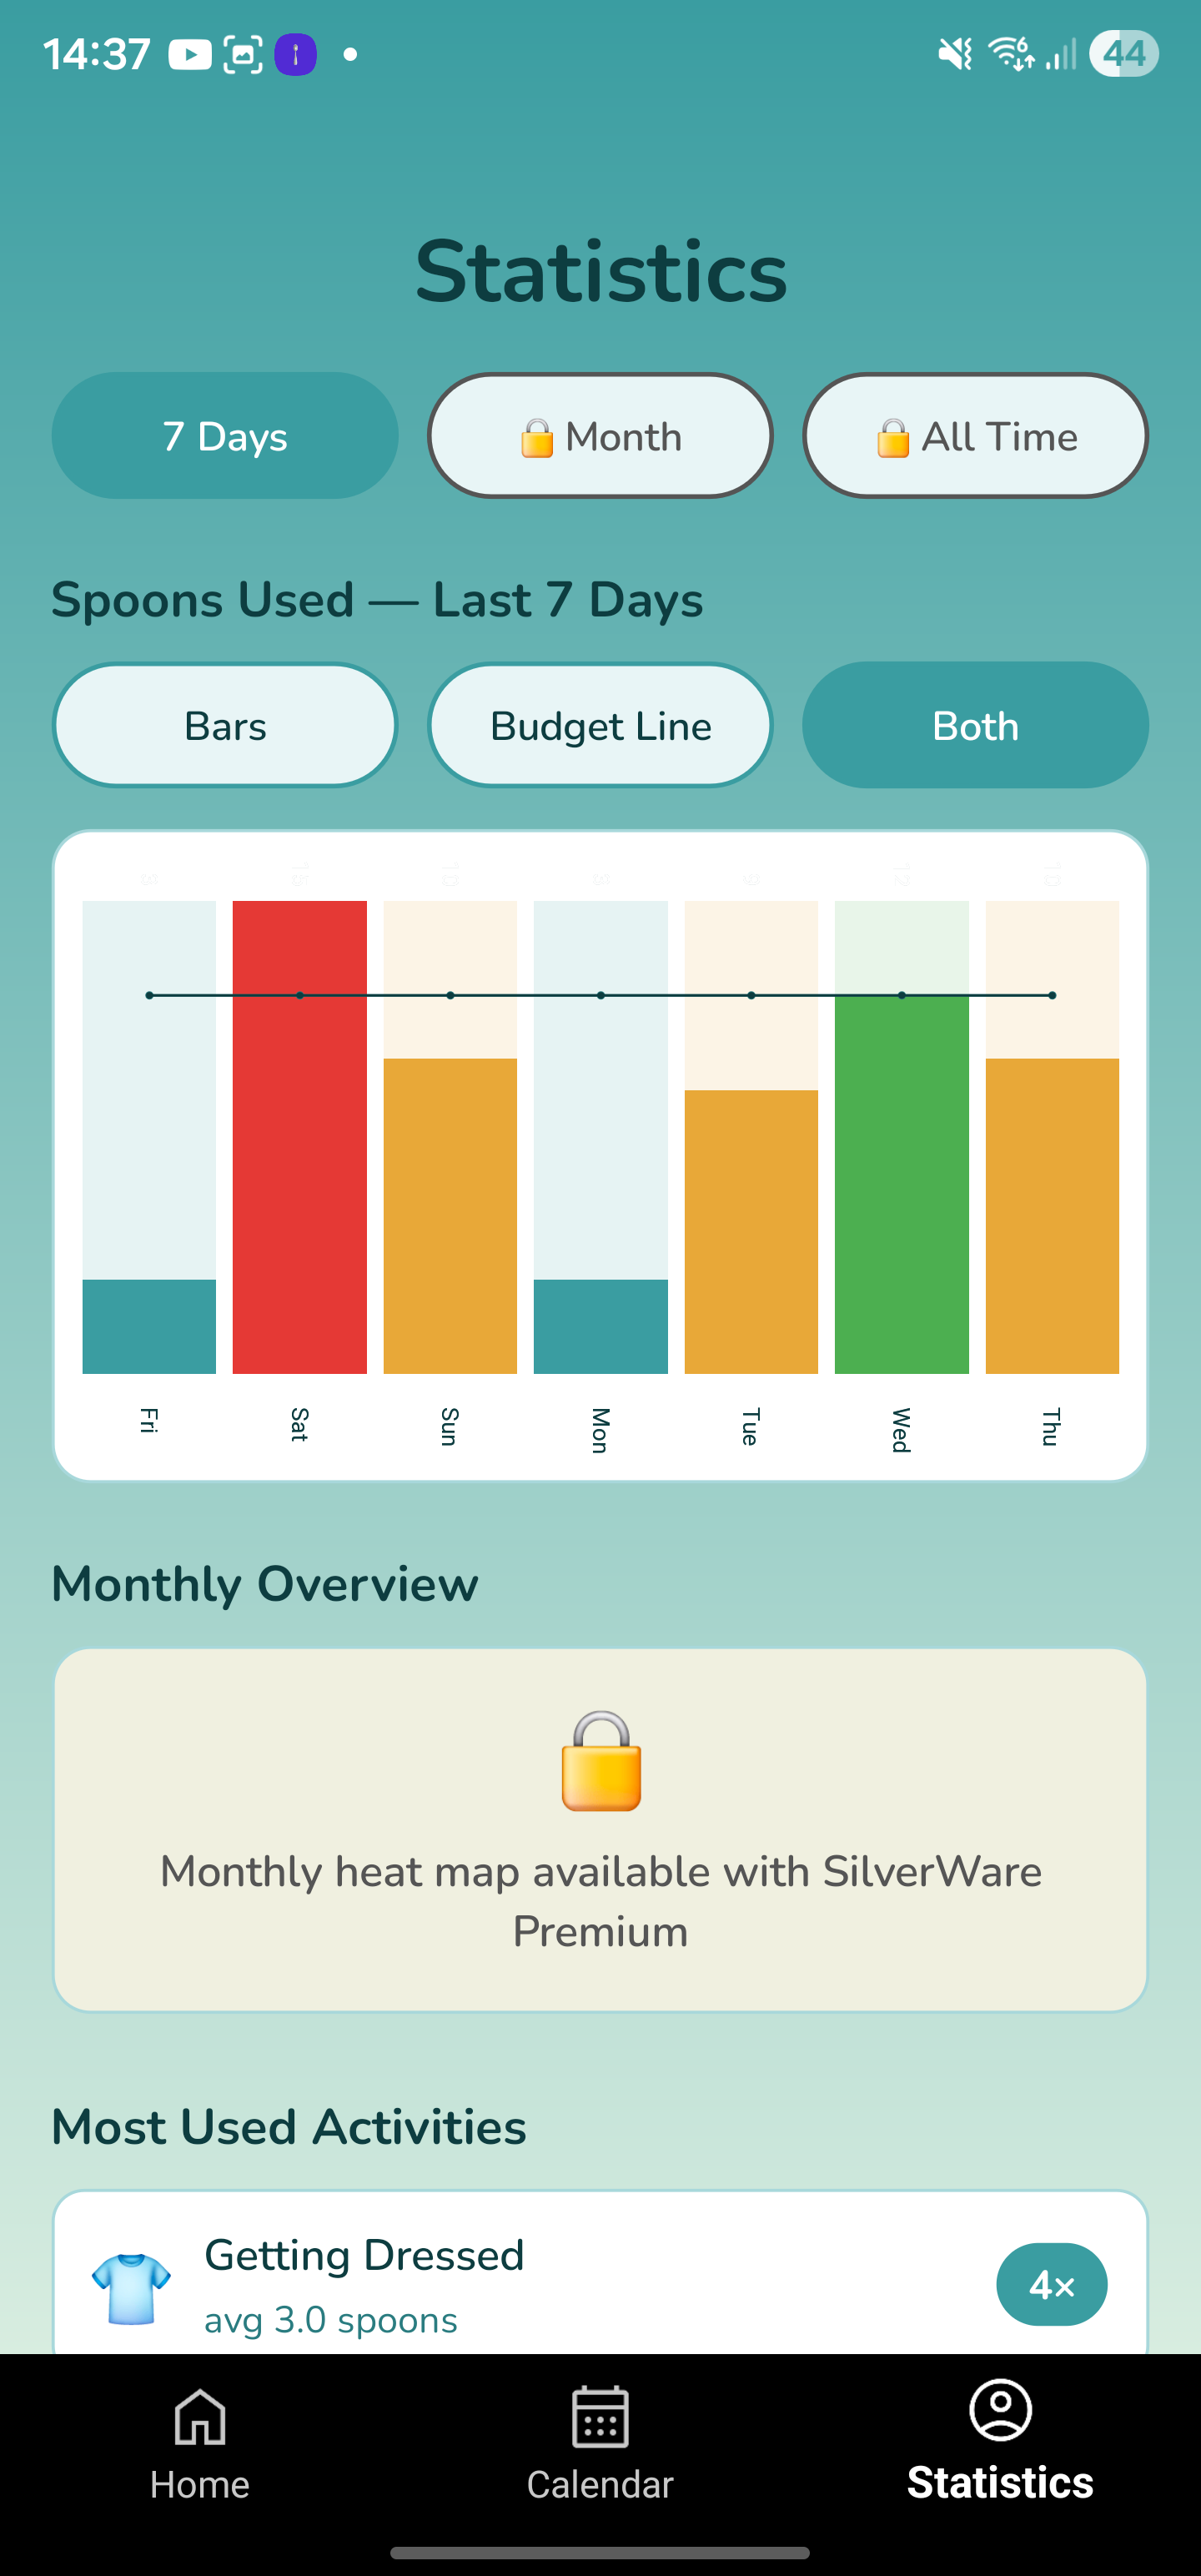
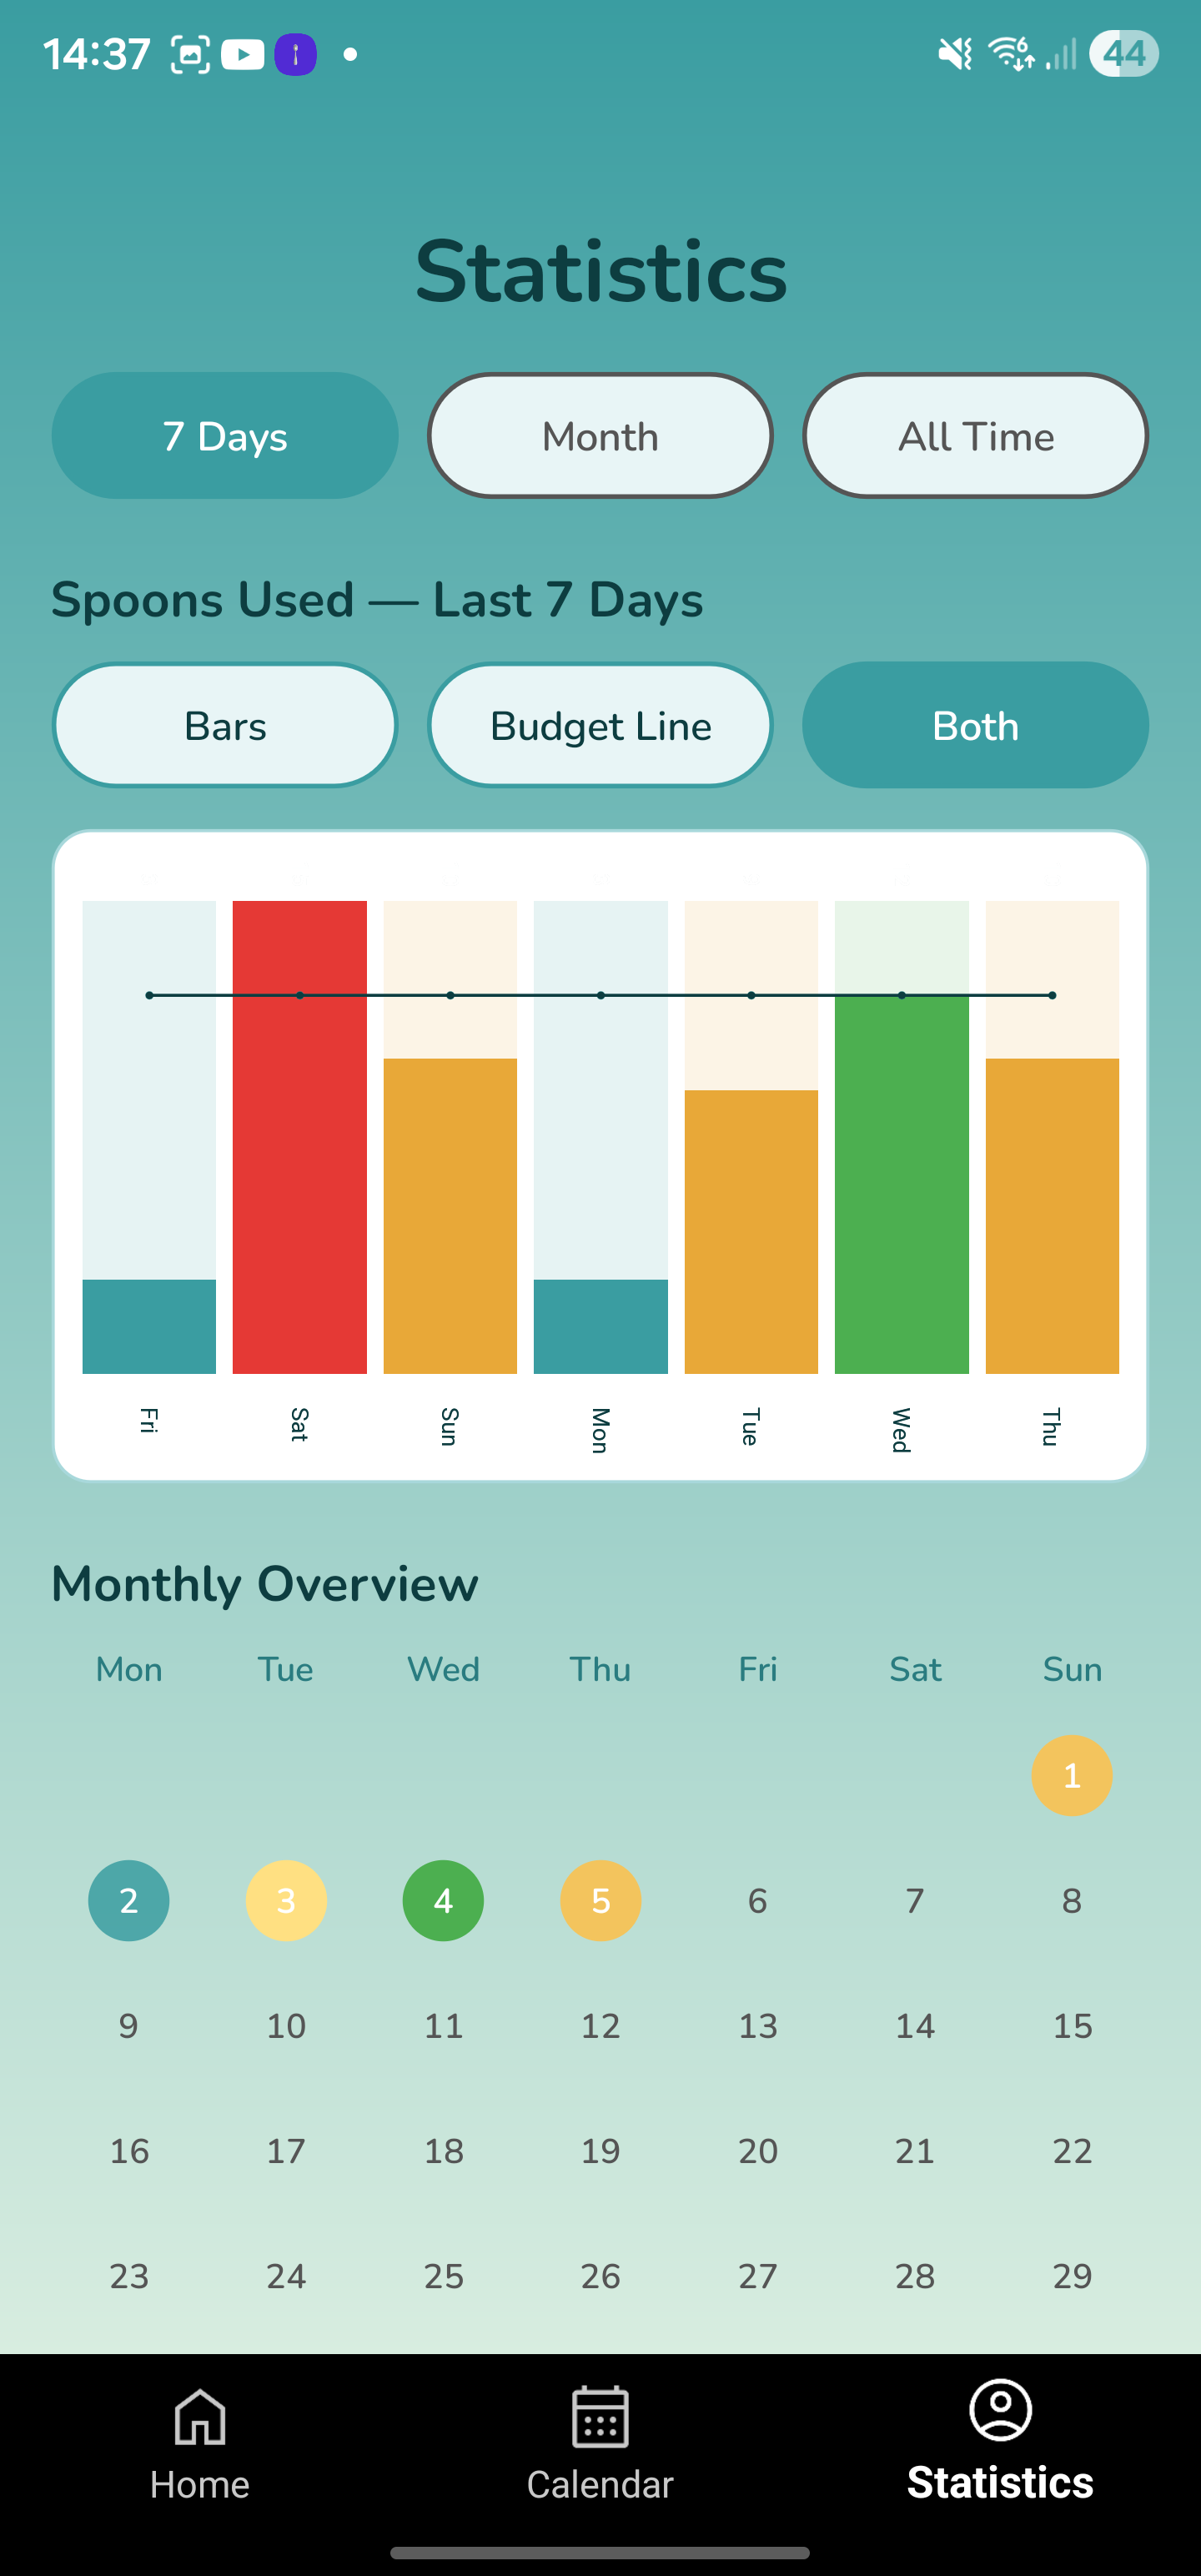
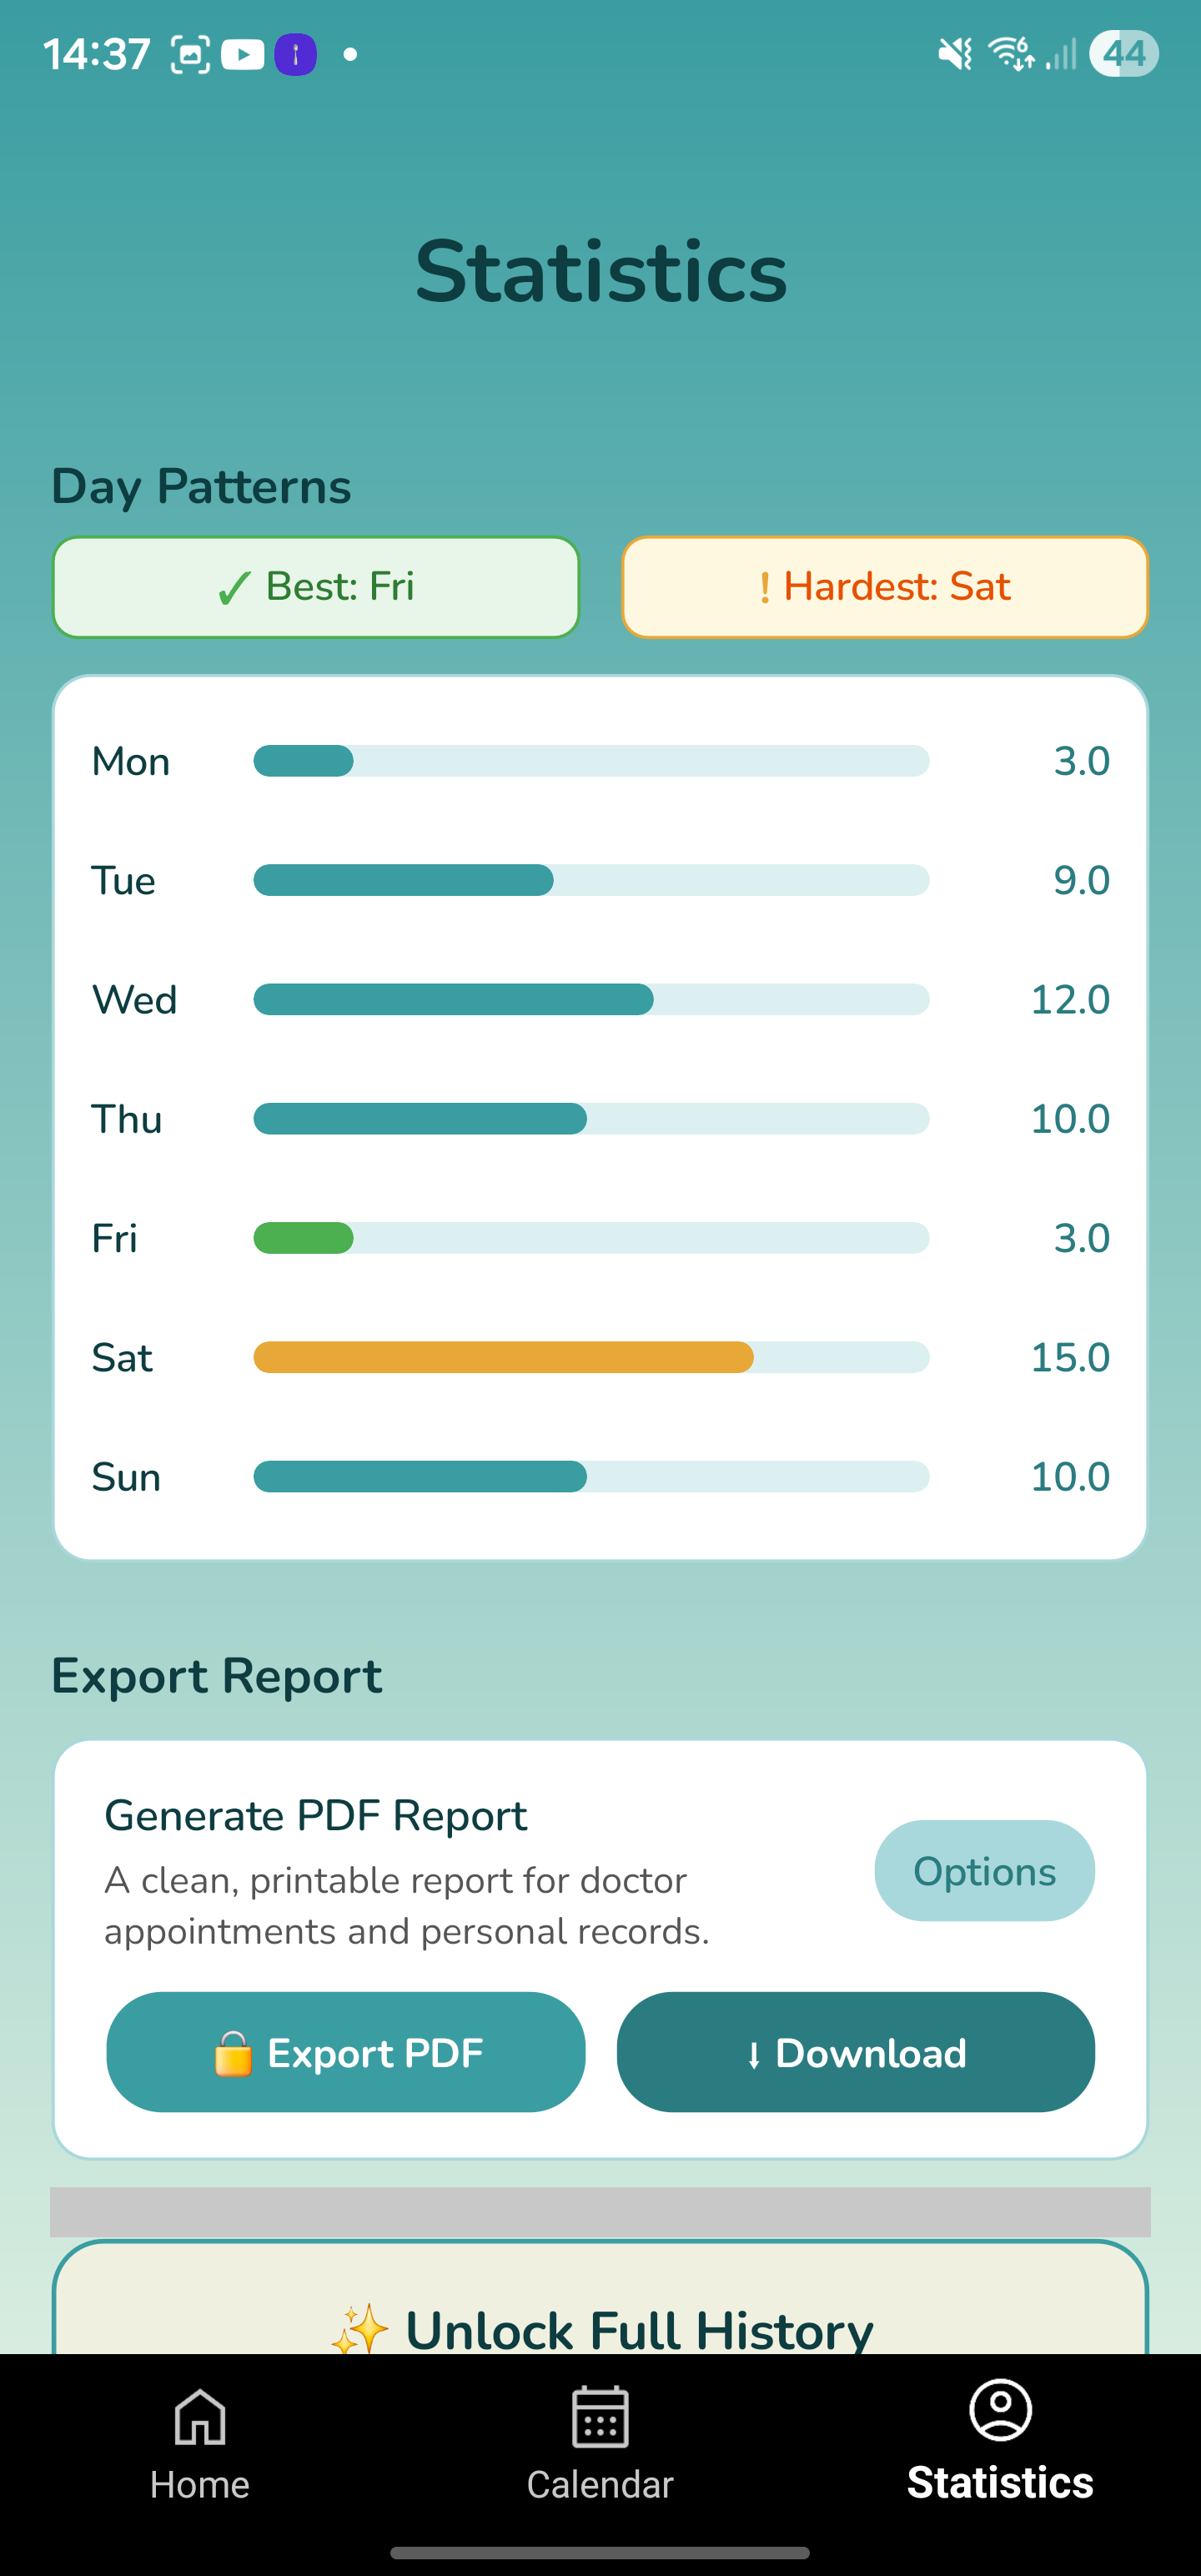
SilverWare brings Spoon Theory to life. Track your daily energy budget, understand your limits, and make the most of every moment — no matter how many spoons you wake up with.
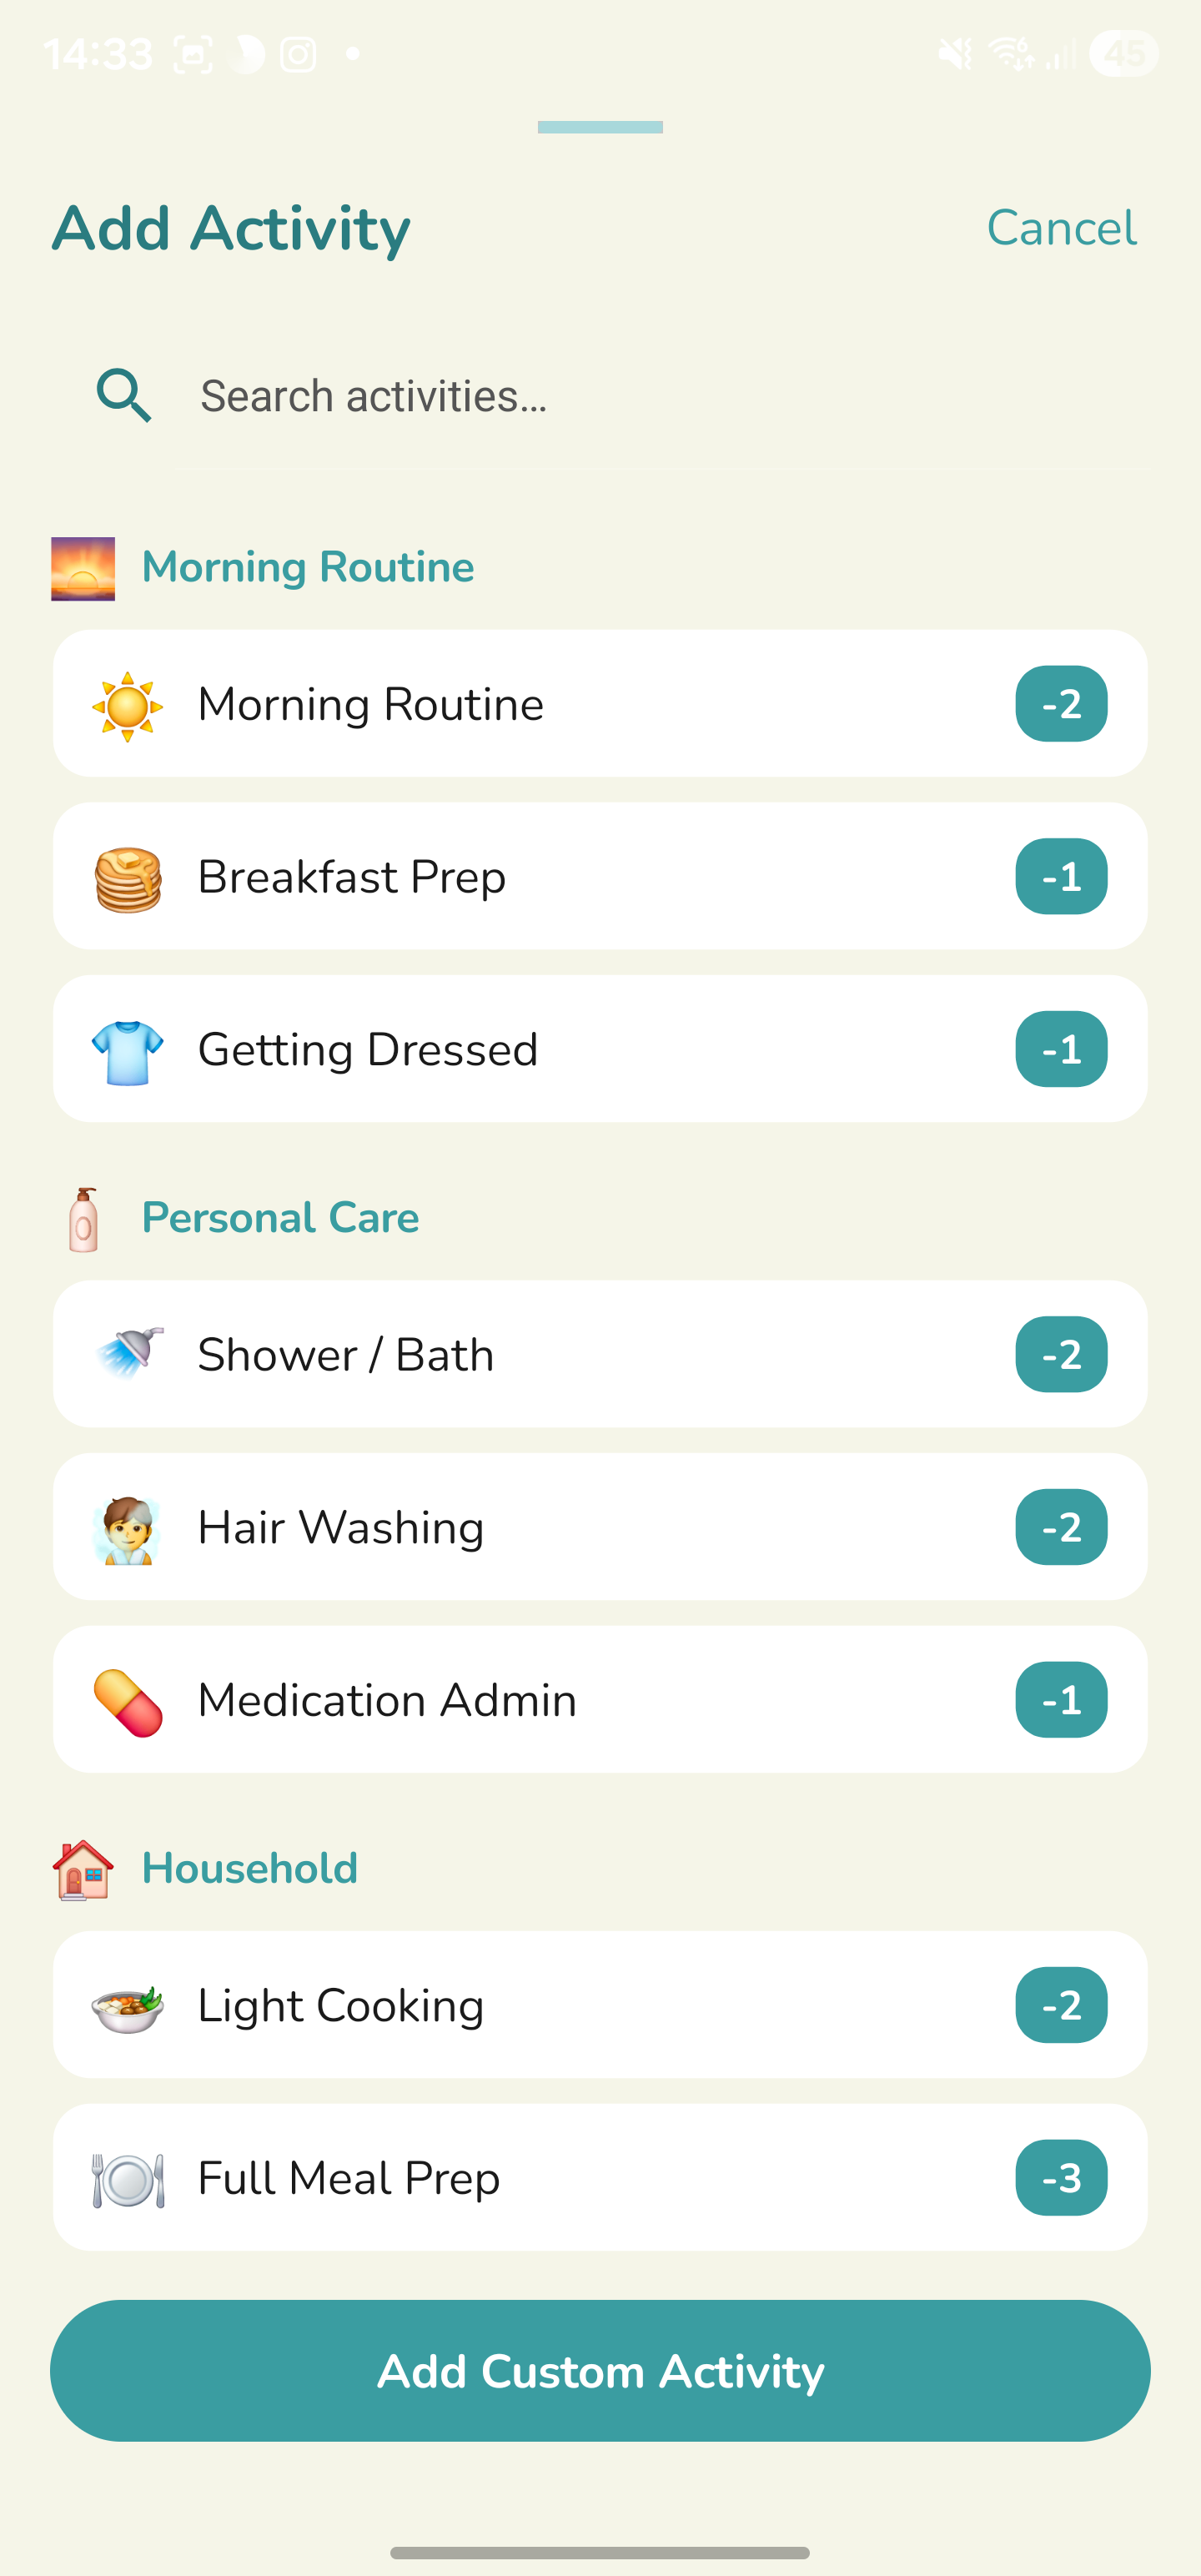
26+
Activity presets
Free
To download
Doctor reports